Height: Approximately 30,000 ft (9,000 m)
The 250 millibar chart is used to locate the jet stream's position. This is key to forecasting where weather systems will travel, and also whether or not they'll undergo any strengthening (cyclogenesis).
The 250 Mb chart depicts isotachs (blue color-filled contours at intervals of 10 knots) and winds (in m/s).

500 MB
Height: Approximately 18,000 ft (5,000 m)
Forecasters use the 500 millibar chart to locate troughs and ridges, which are the upper air counterparts of surface cyclones (lows) and anticyclones (highs).
The 500 Mb chart shows absolute vorticity (pockets of yellow, orange, red, and brown color-filled contours at intervals of 4) and winds (in m/s). X's represent regions where vorticity is at a maximum, while N's represent vorticity minimums.

700 MB
Height: Approximately 10,000 ft (3,000 m)
The 700 millibar chart gives meteorologists an idea of how much moisture (or dry air) the atmosphere holds.
Its chart depicts relative humidity (green color-filled contours at less than 70%, 70%, and 90+% humidity) and winds (in m/s).

Height: Approximately 10,000 ft (3,000 m)
The 700 millibar chart gives meteorologists an idea of how much moisture (or dry air) the atmosphere holds.
Its chart depicts relative humidity (green color-filled contours at less than 70%, 70%, and 90+% humidity) and winds (in m/s).

850 MB
Height: Approximately 5,000 ft (1,500 m)
The 850 millibar chart is used to locate low-level jet streams, temperature advection, and convergence. It's also useful in locating severe weather (it's typically located along and to the left of the 850 Mb jet stream).
The 850 Mb chart depicts temperatures (red and blue isotherms in °C) and wind barbs (in m/s).

1000 MB (Surface)
Height: Approximately 300 ft (100 m) above ground-level
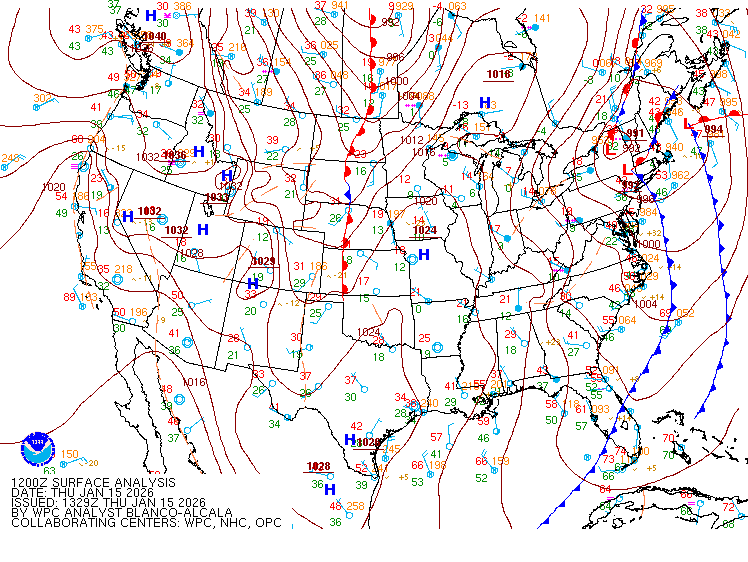
Monitoring the 1000 millibar level is crucial because it lets forecasters know what the near-surface weather conditions are we're feeling right where we live.
1000 Mb charts generally show high and low-pressure areas, isobars, and weather fronts. Some also include observations like temperature, dewpoint, wind direction, and wind speed.

 "
"
 "
"
 "
"